Illustrative report based on a fictional transaction
Project Granite: Managed IT services, Colorado · $10.0M
The buyer’s question
Is $10.0M the right enterprise value for a managed IT provider, when the bank requires a buy-side QoE before it lends?
The finding
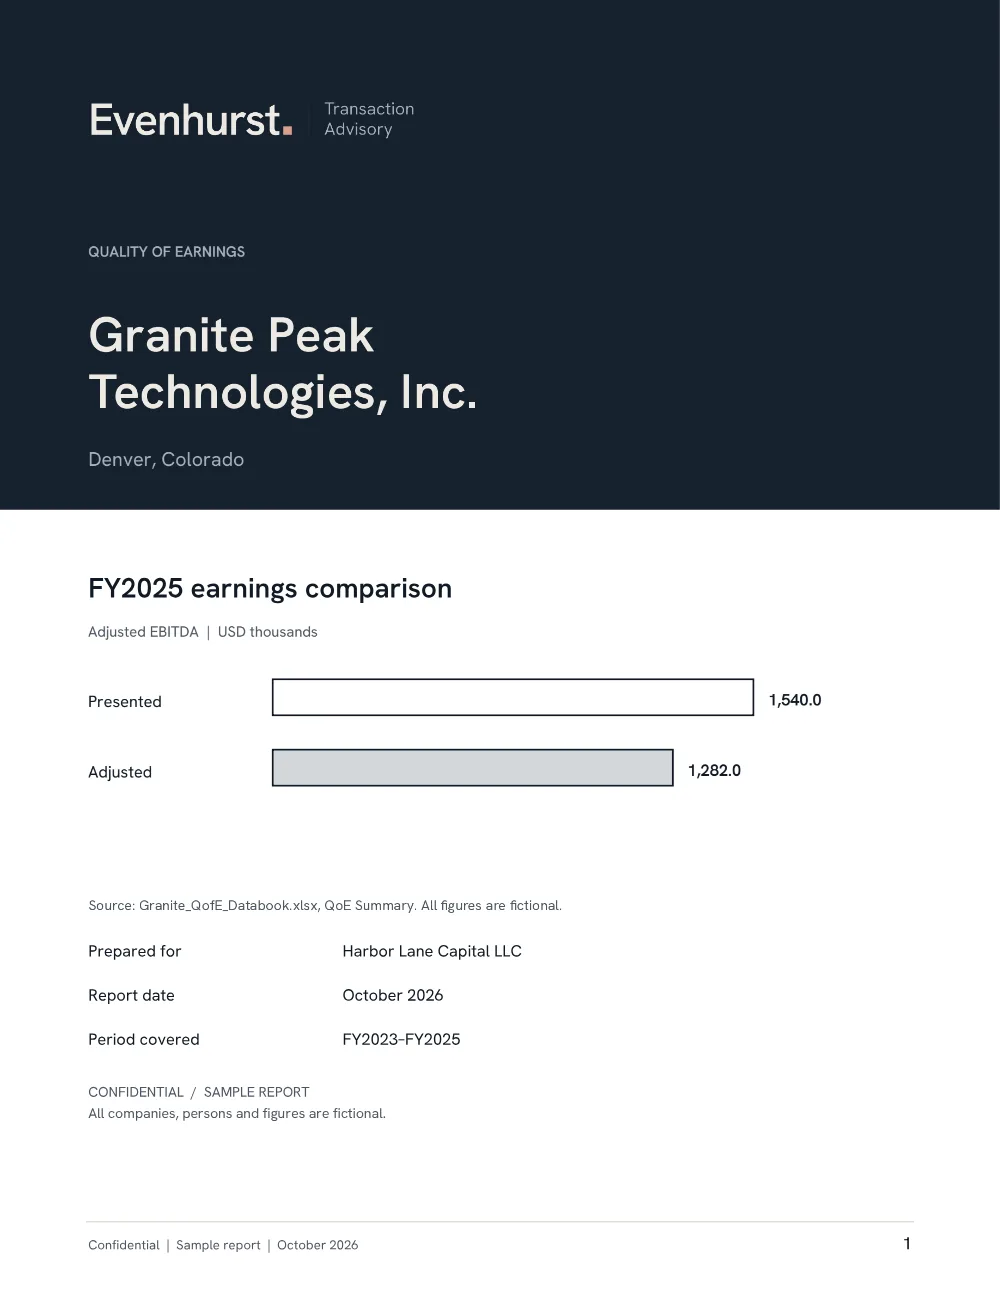
Illustrative adjusted EBITDA is $1,282k, 17% below the banker’s $1,540k. At the ask the sponsor pays 7.8x, and the five-year return falls to about 11%.
How the analysis supports it
- Capitalized development labor expensed: −$120k
- Lost top-10 client at run-rate: −$95k; bonus under-accrual: −$30k
- Net revenue retention 103% to 97% over three years
- Return about 11% at the ask, about 17% at a supported price
What it changes
Proceed at $8.2–8.6M, or at $9.0M with a $0.8–1.0M earnout tied to retention, with deferred revenue treated as debt-like in the peg and key staff retained.
Engagement that produces it
Transaction Assessment. Its full Quality of Earnings supports the bank’s review; the valuation and financing analysis inform the proposed price and structure.
Recurring revenue is softening just as the price assumes it is strengthening.